In our ElasticSearch database, we merge together large datasets from multiple sources. This allows the user to discover brand new connections and extract useful information from completely new areas. In this article, we will go through some powerful use cases with NPT events.
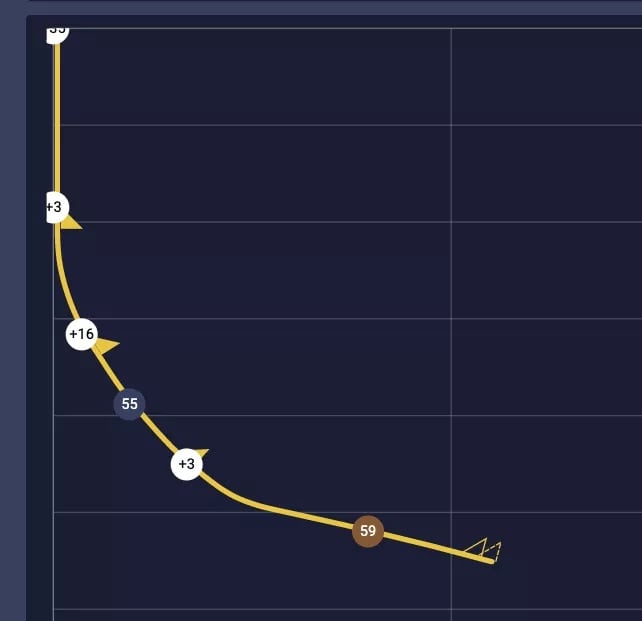
NPT events usually come with a depth tag, which allows us to visualise where in the wellbore they occurred. If they don't have a depth associated with them, we look for a time tag, and run that against the wellbore's time-depth curve (if present) and are able to get an estimated depth from that:
Knowing where in the well the event happened opens up an entirely new alley of analyses, as we already know everything there is to know about each depth point in the well.
Here are just a few examples of questions you will be able to find answers to when you combine NPT statistics with existing features like filters and our ML similarity cluster:
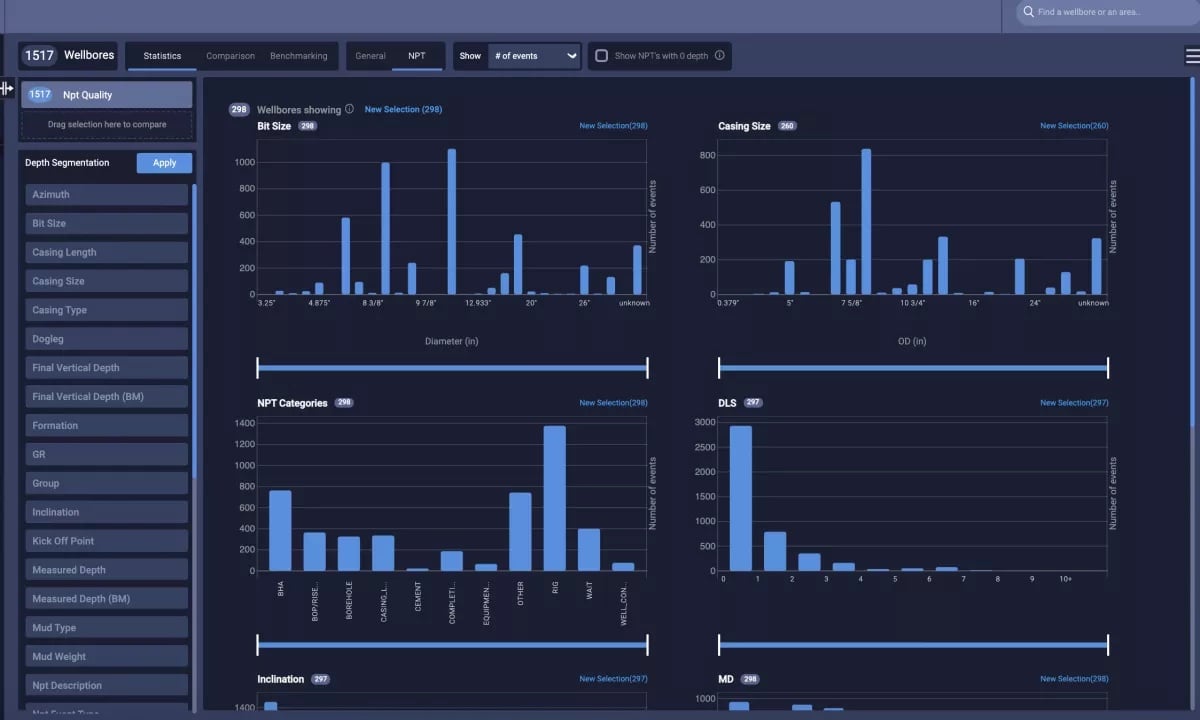
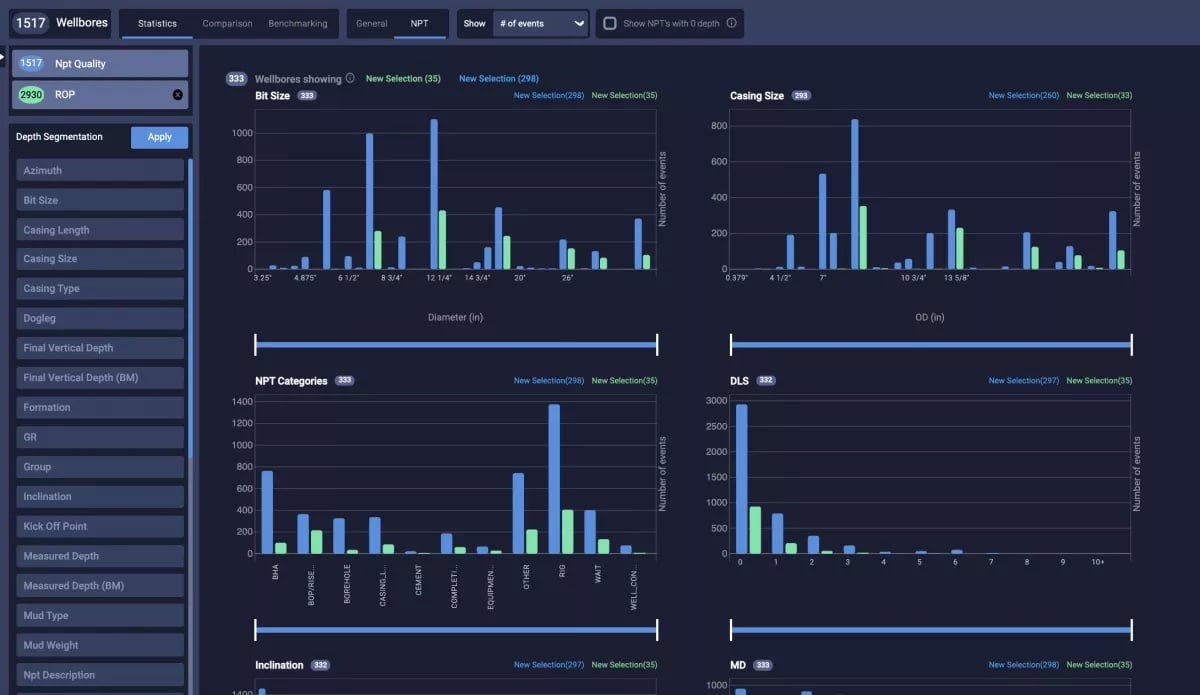
This is the main view of the NPT statistics tab. You'll notice a number of bar plots and histograms, showing you how the NPT events present in your wellbore selection distribute across multiple variables.
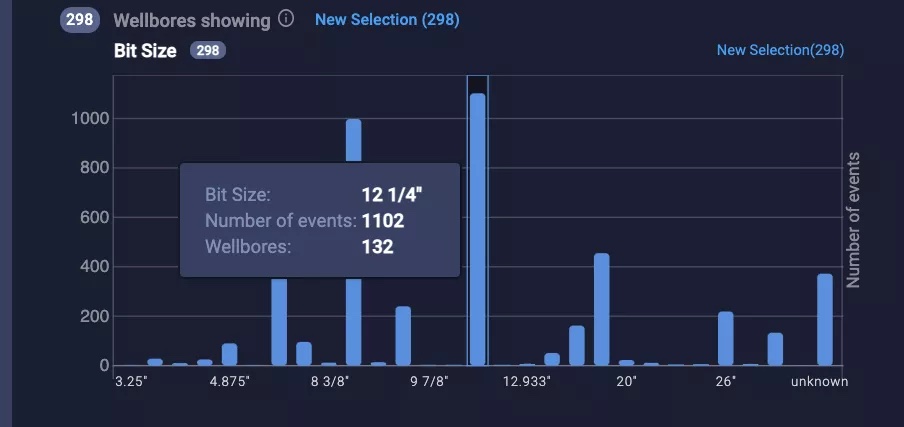
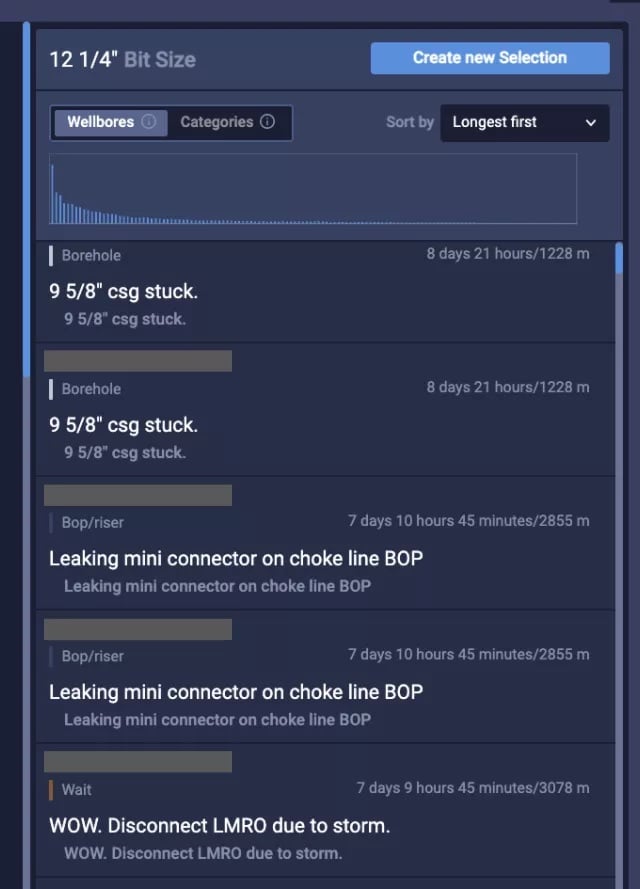
For example, there seem to be a lot of events in 12 1/4" bit sections. Hovering a specific bar shows you how many events make up that bar, and how many wellbores are represented in that bar: 1102 events from 132 wellbores.

Clicking a bar brings up a side panel with detailed information about the events in that bar, where you can read everything about each event, and filter on event categories and wellbore names.
Number of events is the default setting for the y-axis, and gives a good overview of where most of the events happen. But we can do better:
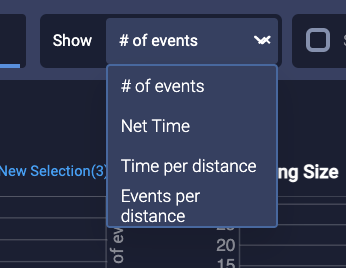
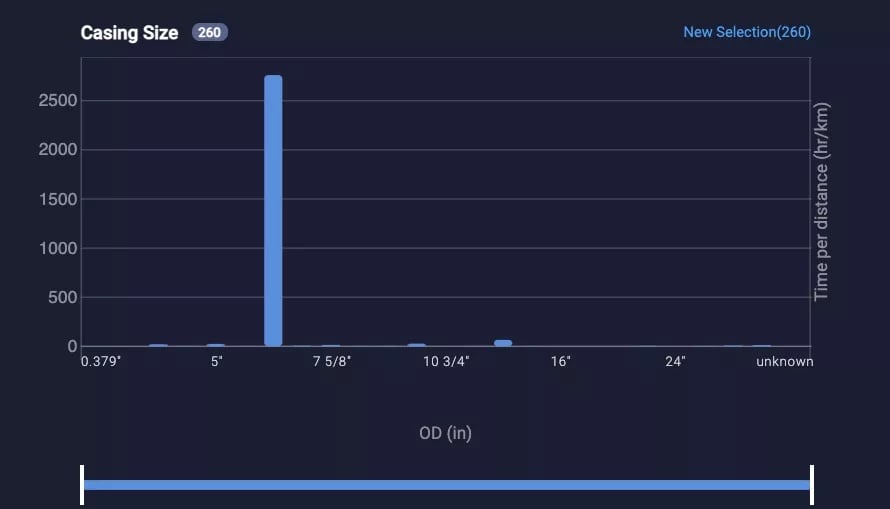
At the top of the screen, we allow you to switch the y axis to show either "net time", meaning how many hours were lost due to events, # of events per distance drilled, or total time pr distance drilled. The "per distance" options will help you find those rare combinations of factors that don't occur very often, but cause a lot of headache when they do.. For example that one time someone tried to drill a short 6" section, and got into some real trouble:
Some times you may want to dig even a little deeper.
For example; you have this group of 1500 offset wells that you're looking at, and you have gotten an idea of where events are most likely to occur.
But now you want to look at only the events that occur in specific areas of the wellbores in your group.
We allow you to do that, with a feature we have called Depth Segmentation.
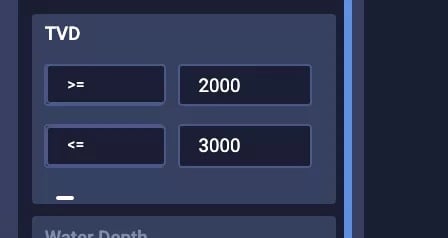
The most basic way to utilize this feature is to say "I only want to see events between 2000m and 3000m tvd". Simply locate the "tvd" section in the left sidepanel, and input your range. The plots will now update to show the distribution of only events occurring in that range.
Similarly, you can find "Only events that occur at inclination > 60", or "Events that occurred in 13 3/8" sections", or "at doglegs > 2", or.... the list goes on.
Obviously, combinations of filters are possible as well.
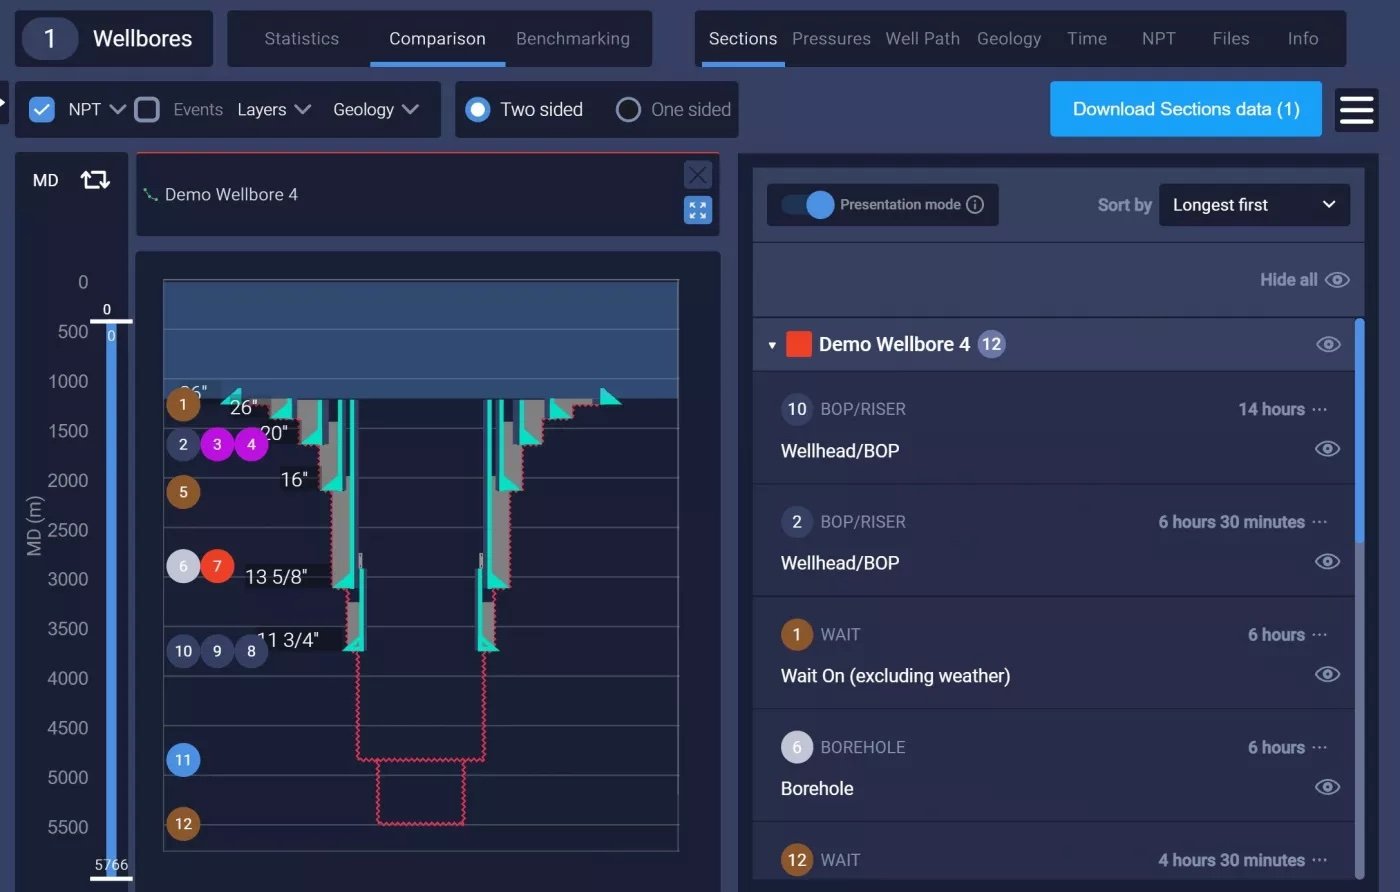
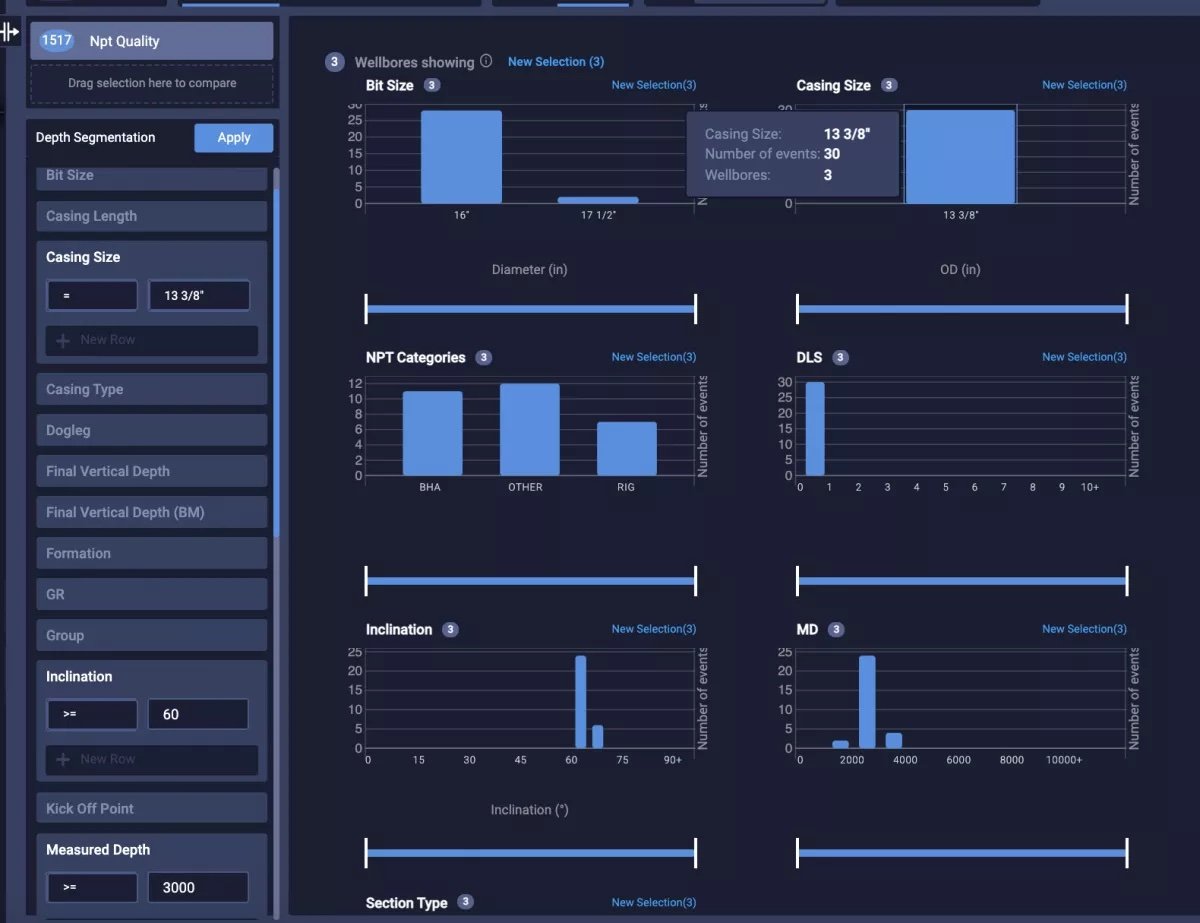
For example "Events occurring in 13 3/8" sections with inclination > 60, deeper than 3000m md" would look like this:
Looks like there's 30 events to investigate, spread across 3 wellbores in my selection. Most of those events are BHA and RIG related.
In the top left corner, you'll find a field saying "Drag selection here to compare".
This feature could be used to compare wellbores from one field to wellbores from another to look for a differences or similarities, or you could look at your small selection vs global statistics, to look for patterns that make your selection unique, or representative.